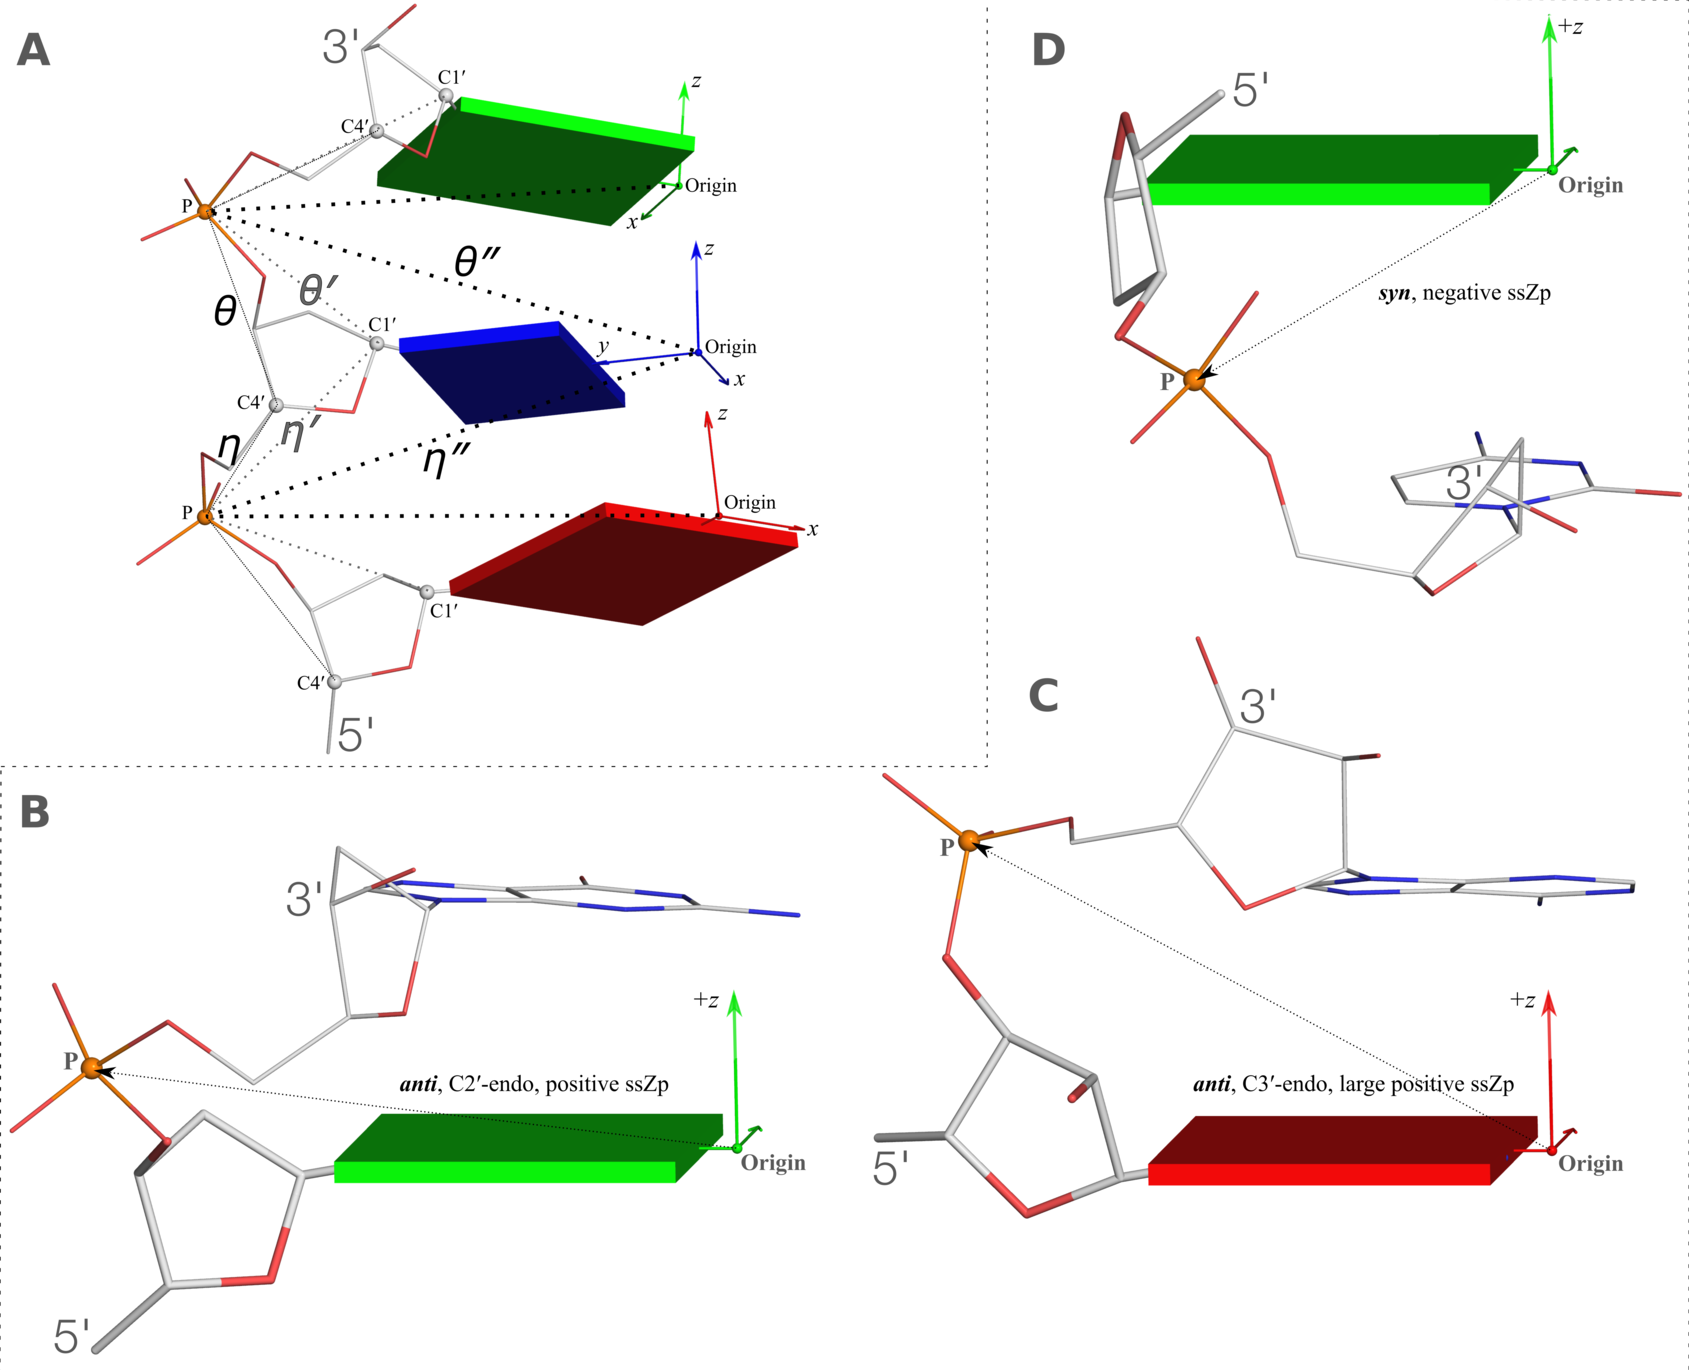
Figure 2. New structural parameters that connect base and backbone atoms. (A) A pair of virtual torsion angles (η′′ and θ′′) that are based on the positions of the phosphorus atoms (P) and the origins of the intervening bases in their standard base reference frames (7). Two closely related forms of virtual backbone torsion angles are depicted for comparison: the classic version (η and θ) defined by the P and C4′ atoms (27), and a more recent variant (η′ and θ′) based on the P and C1′ atoms (28). Here, an ApTpG trinucleotide from a B-DNA fiber model is used for illustration, with base reference frames attached. Note that the standard base frames of purines and pyrimidines are symmetrical with respect to the dyad of an idealized Watson–Crick base pair, and thus independent of base identity (21): the base origin is accordingly more displaced from the atoms of T (a pyrimidine) than those of A or G (purines). (B–D) Single-stranded phosphate displacement, ssZp, in representative helical structures showing: (B) a small, positive number for a GpG step from a B-DNA fiber model where a C2′-endo sugar attaches to a base in an anti conformation (ssZp = +1.84 Å); (C) a large, positive value for an ApA step from an RNA fiber model where a C3′-endo sugar attaches to a base in an anti conformation (ssZp = +4.38 Å); (D) a negative value for a GpC step from a Z-DNA fiber model where the G adopts a syn conformation (ssZp = −1.74 Å). Color code for base blocks: A, red; G, green; T, blue. The illustrations were generated with DSSR (21) and PyMOL (
https://pymol.org).
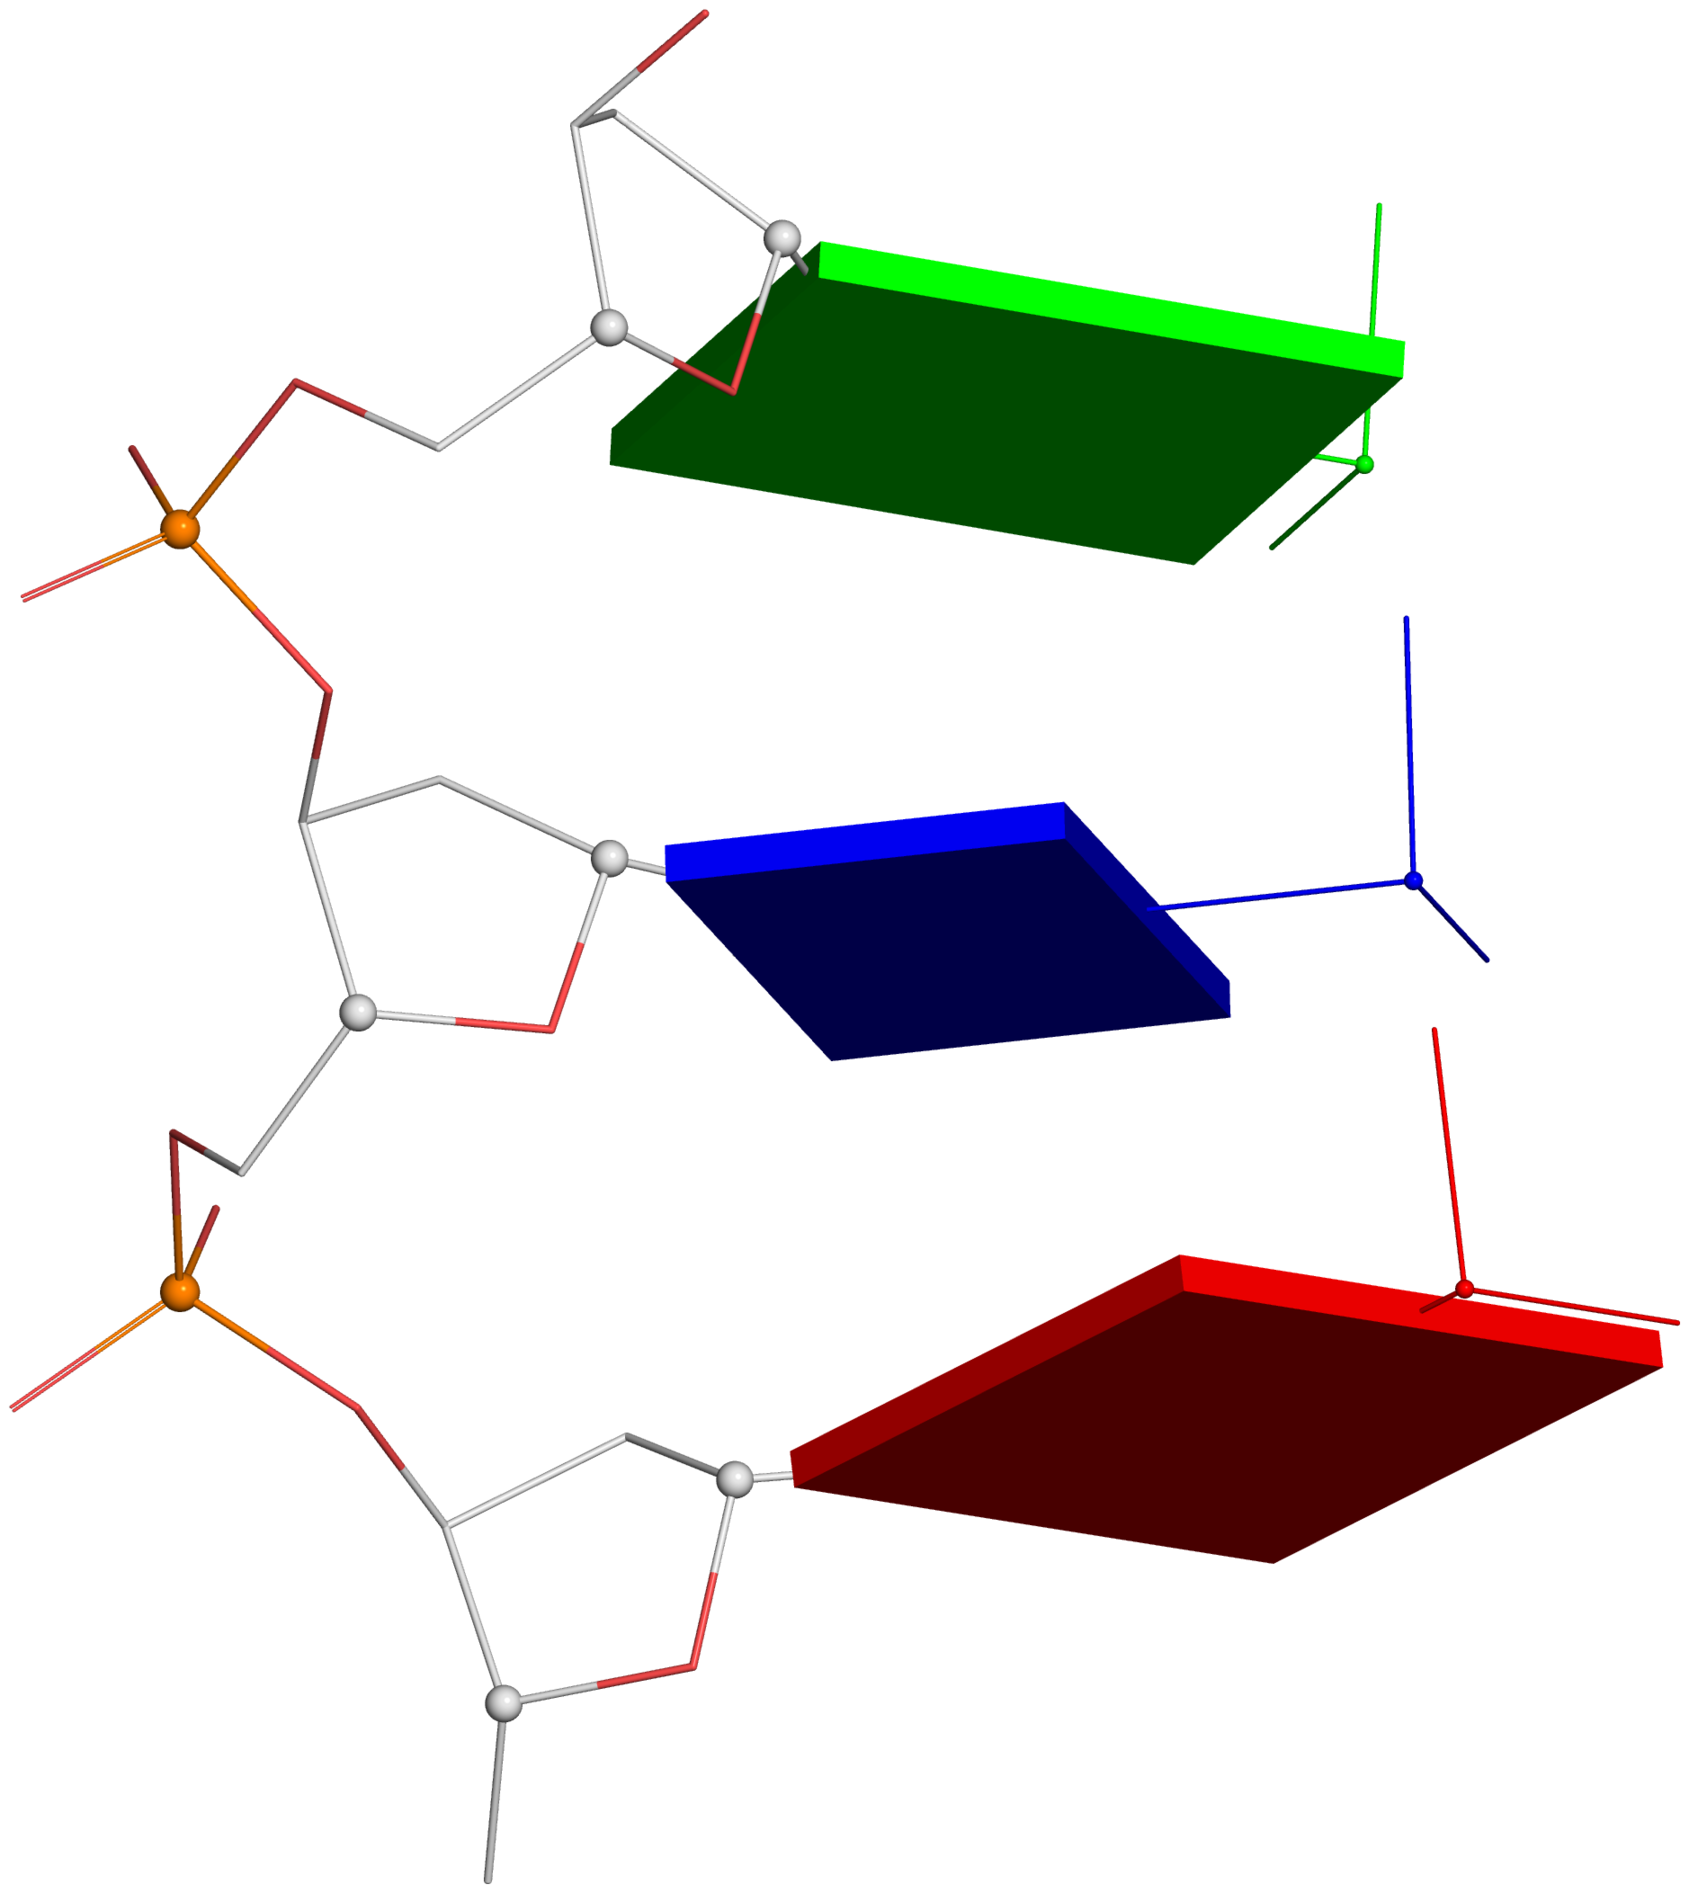
Fig. 1A:
virtual torsion anglesfiber -seq=ATG --single pseudo-torsion-raw.pdb
# remove the leading phosphate group for clarity
tail +6 pseudo-torsion-raw.pdb > pseudo-torsion.pdb
# load 'pseudo-torsion.pdb' into PyMOL, run the following command commands
load pseudo-torsion.pdb, whole_str
select C1_prime, name C1'
select C4_prime, name C4'
select P, name P
dssr_block block_file=frame, name=frame # via the DSSR-PyMOL plugin
dssr_block block_depth=0.28, name=block
- Line#1: The illustration employs a DNA fragment with base sequence ATG from the B-DNA fiber model, default of the 3DNA fiber program.
- Line#3: Remove the 5'-phosphate group for clarity.
- Lines#5-10: Load 'pseudo-torsion.pdb' into PyMOL, choose a preferred orientation, select P, C1' and C4' atoms, and run two dssr_block commands via the DSSR-PyMOL plugin. In line#10, the thickness of base blocks is set to 0.28 Å from the default value of 0.5 Å.
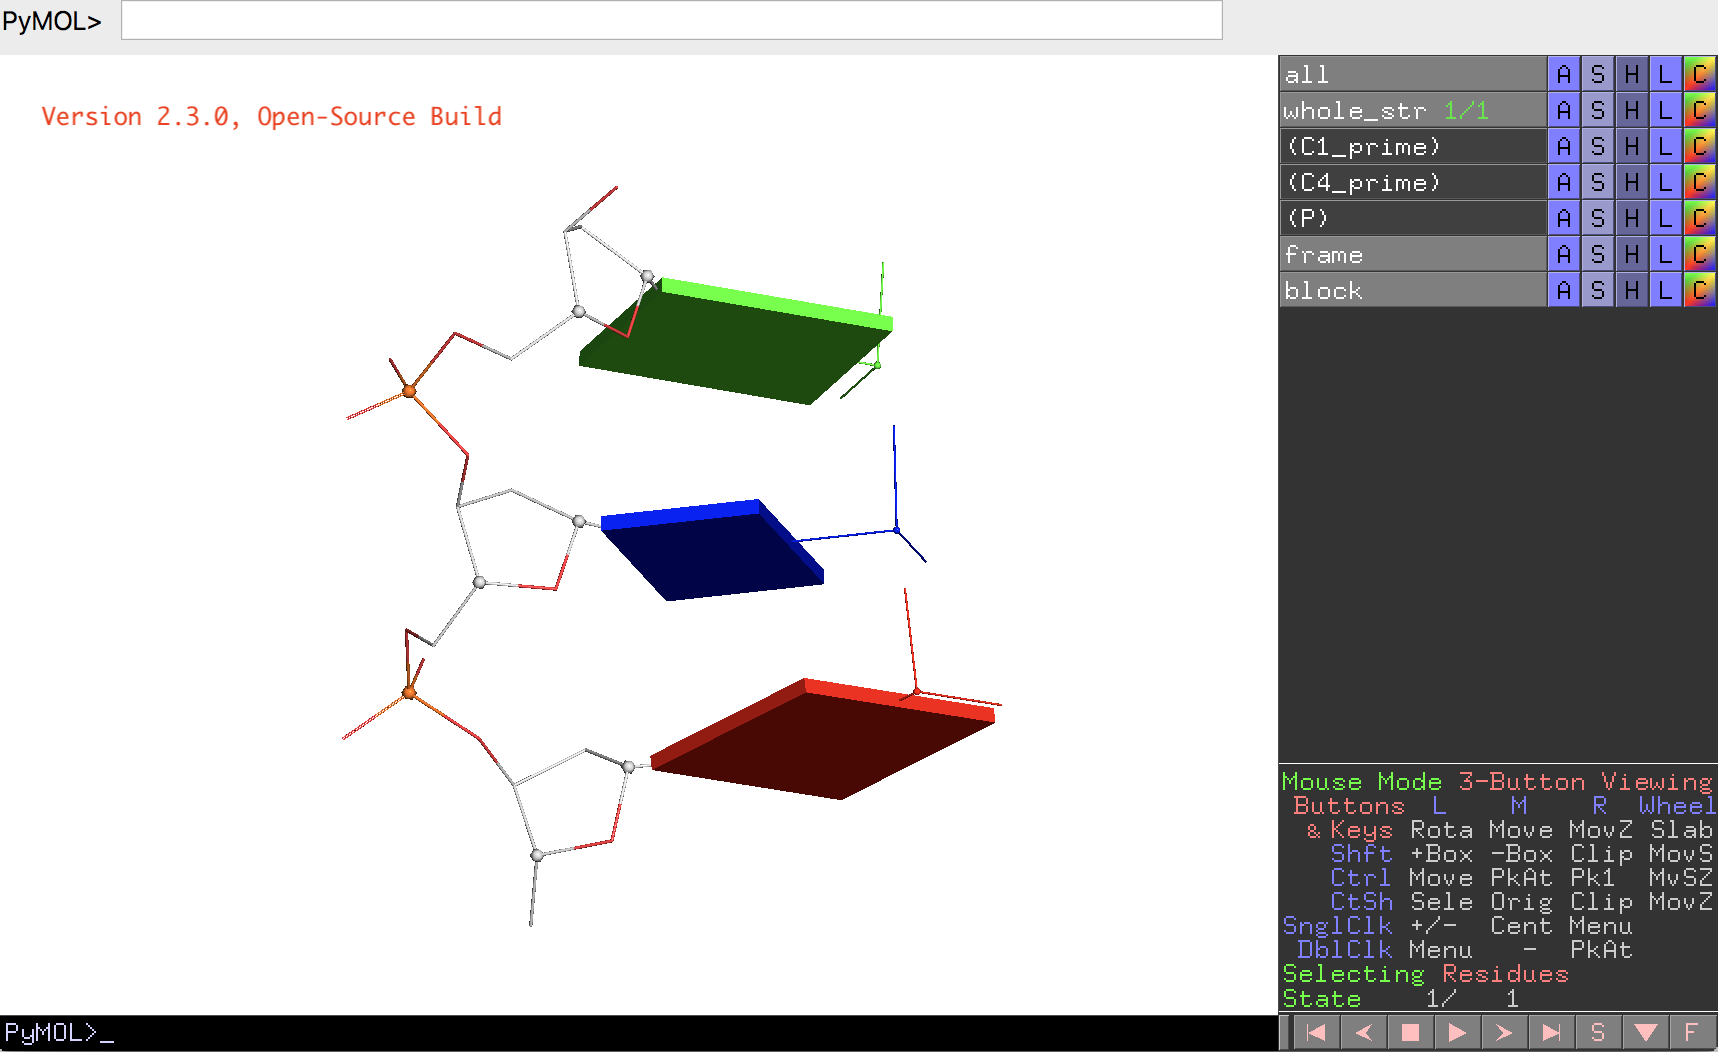
- Within PyMOL, ray-trace the scene and then output a PNG image as depicted below. The corresponding PyMOL screenshot is also added here for reference.
Associate files:
The molecular schematic of a DNA trinucleotide diphosphate is used here to illustrate definitions of pseudo torsions angles. It is worth noting that the concept of
embedded base planes and attached reference frames is
generally applicable to the analysis, construction, and visualization of any 3D nucleic acid-containing structures.
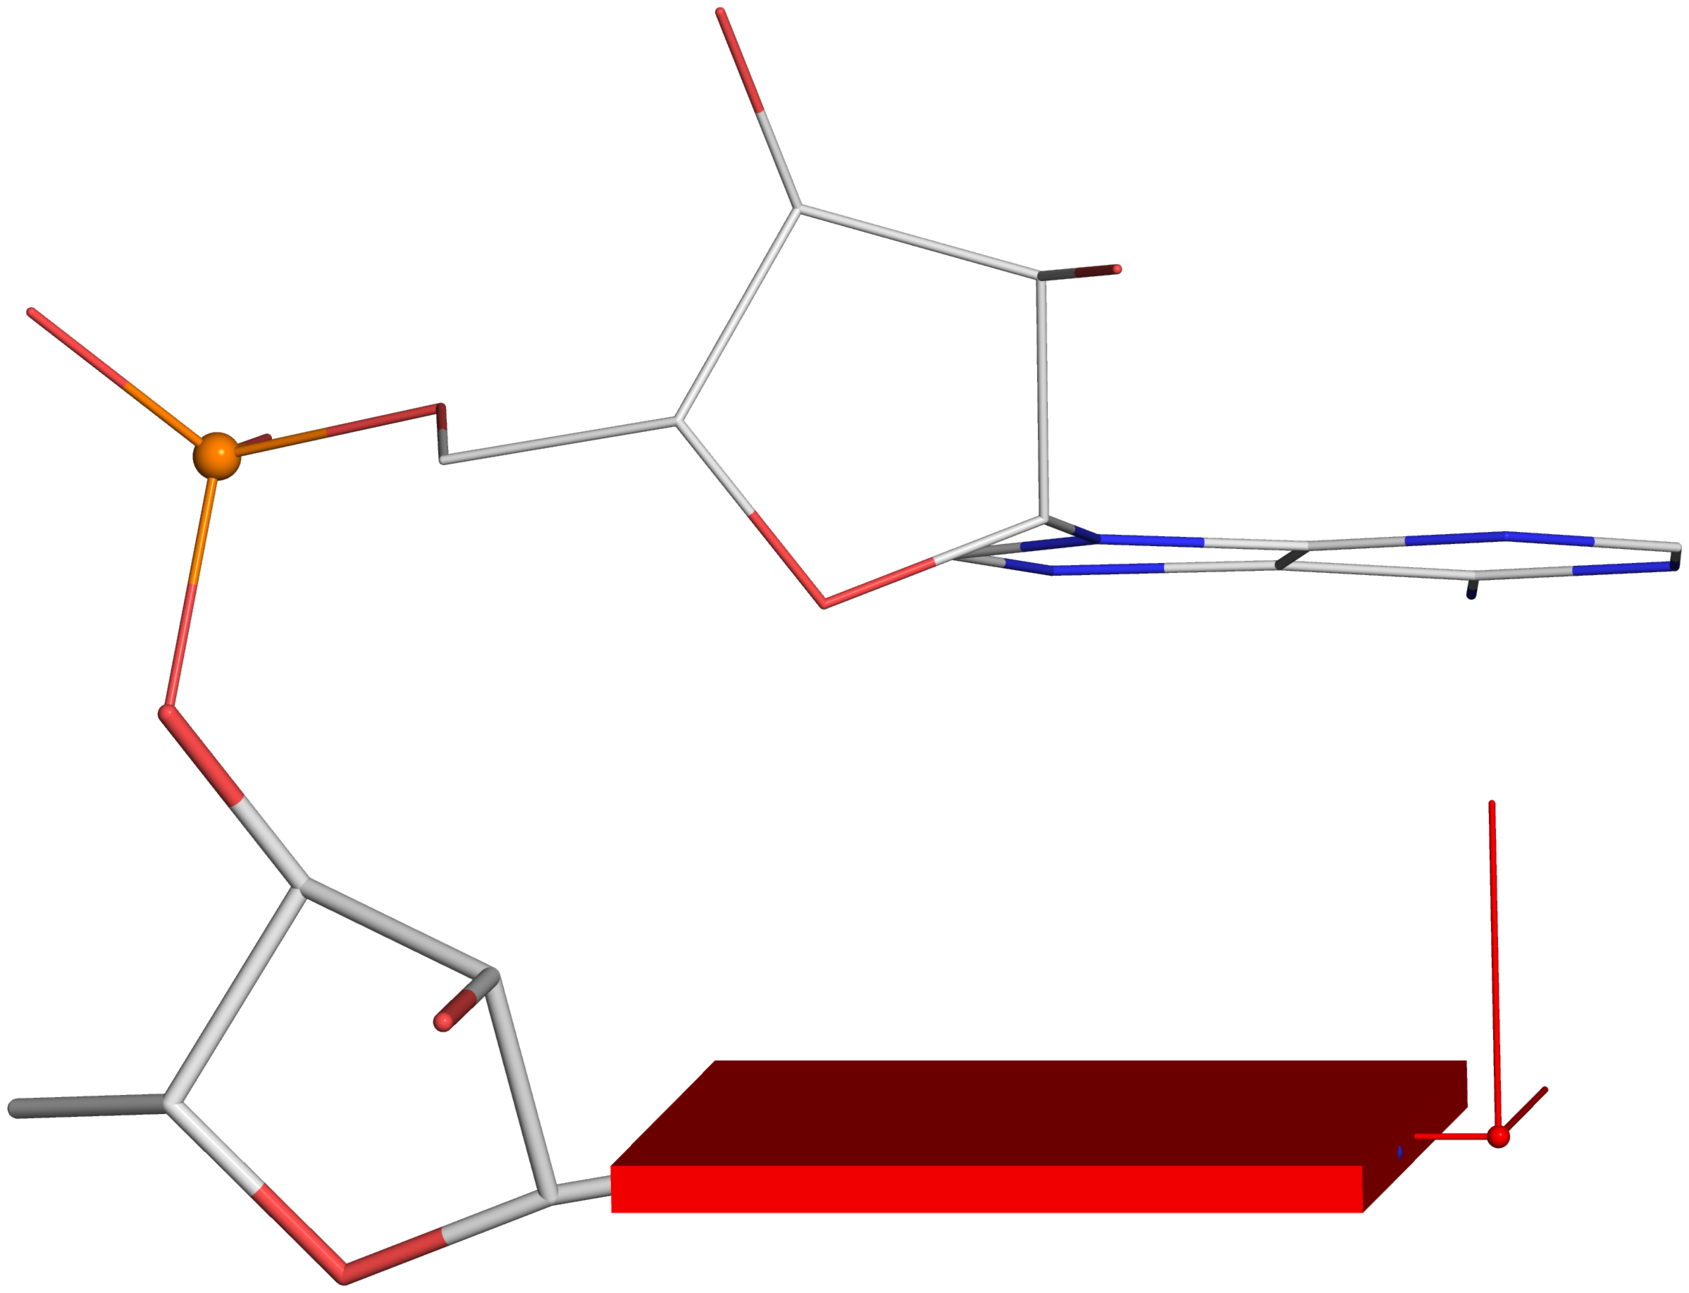
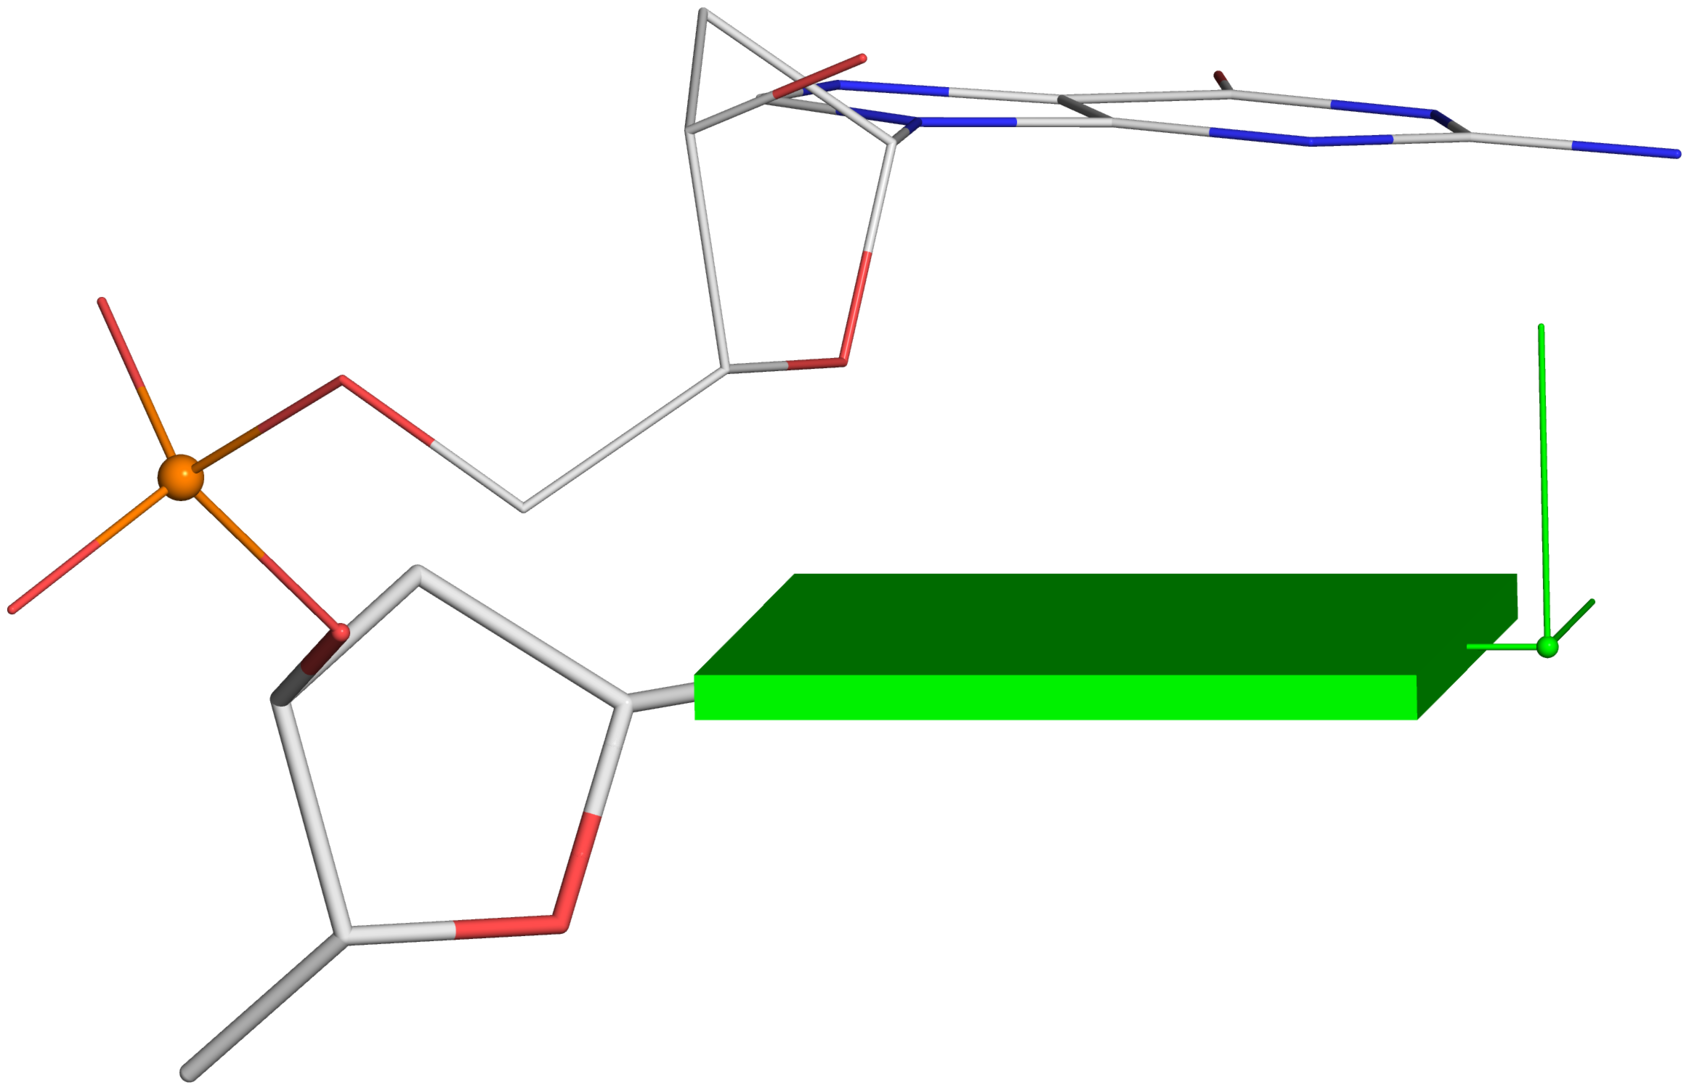
Fig. 2B-D:
Single-stranded phosphate displacement, ssZpThe three cases depicted in Fig. 2B-D are similar in nature for illustration purpose. The procedure for creating Fig. 2C is detailed below. Note the selection of the 5' nucleotide (
base_ref, line #16): the base block and reference frame are attached only to the leading base, not the following one.
# single-stranded RNA, with base sequence AA
fiber --rna --seq=AA --single C3-endo-raw.pdb
# with the minor-groove of A1 facing the viewer
x3dna-dssr -i=C3-endo-raw.pdb --frame='1:minor' -o=C3-endo-view.pdb
tail +6 C3-endo-view.pdb > C3-endo.pdb # remove the 5' phosphate group
# Within PyMOL,
load C3-endo.pdb, whole_str
bg_color white
set orthoscopic, 1
turn x, 8 # slightly change the view so the frame x-axis shows up
turn y, -8
# some settings
select P, name P
select base_ref, resi 1 # select the 5' nucleotide as reference
set stick_radius, 0.03
show sticks
set_bond stick_radius, 0.06, base_ref
hide sticks, (name O6+N2+N6+O2+O4+C7+N3) and base_ref
set sphere_scale, 0.08
show sphere, P
# add the base block and reference frame
dssr_block base_ref, block_file=frame, name=frame
dssr_block base_ref, block_depth=0.28, name=block
Associated files:
Using a similar procedure as the one for Fig. 2C, one can generate the following images from Fig. 2B and 2D.
--
Fig. 2B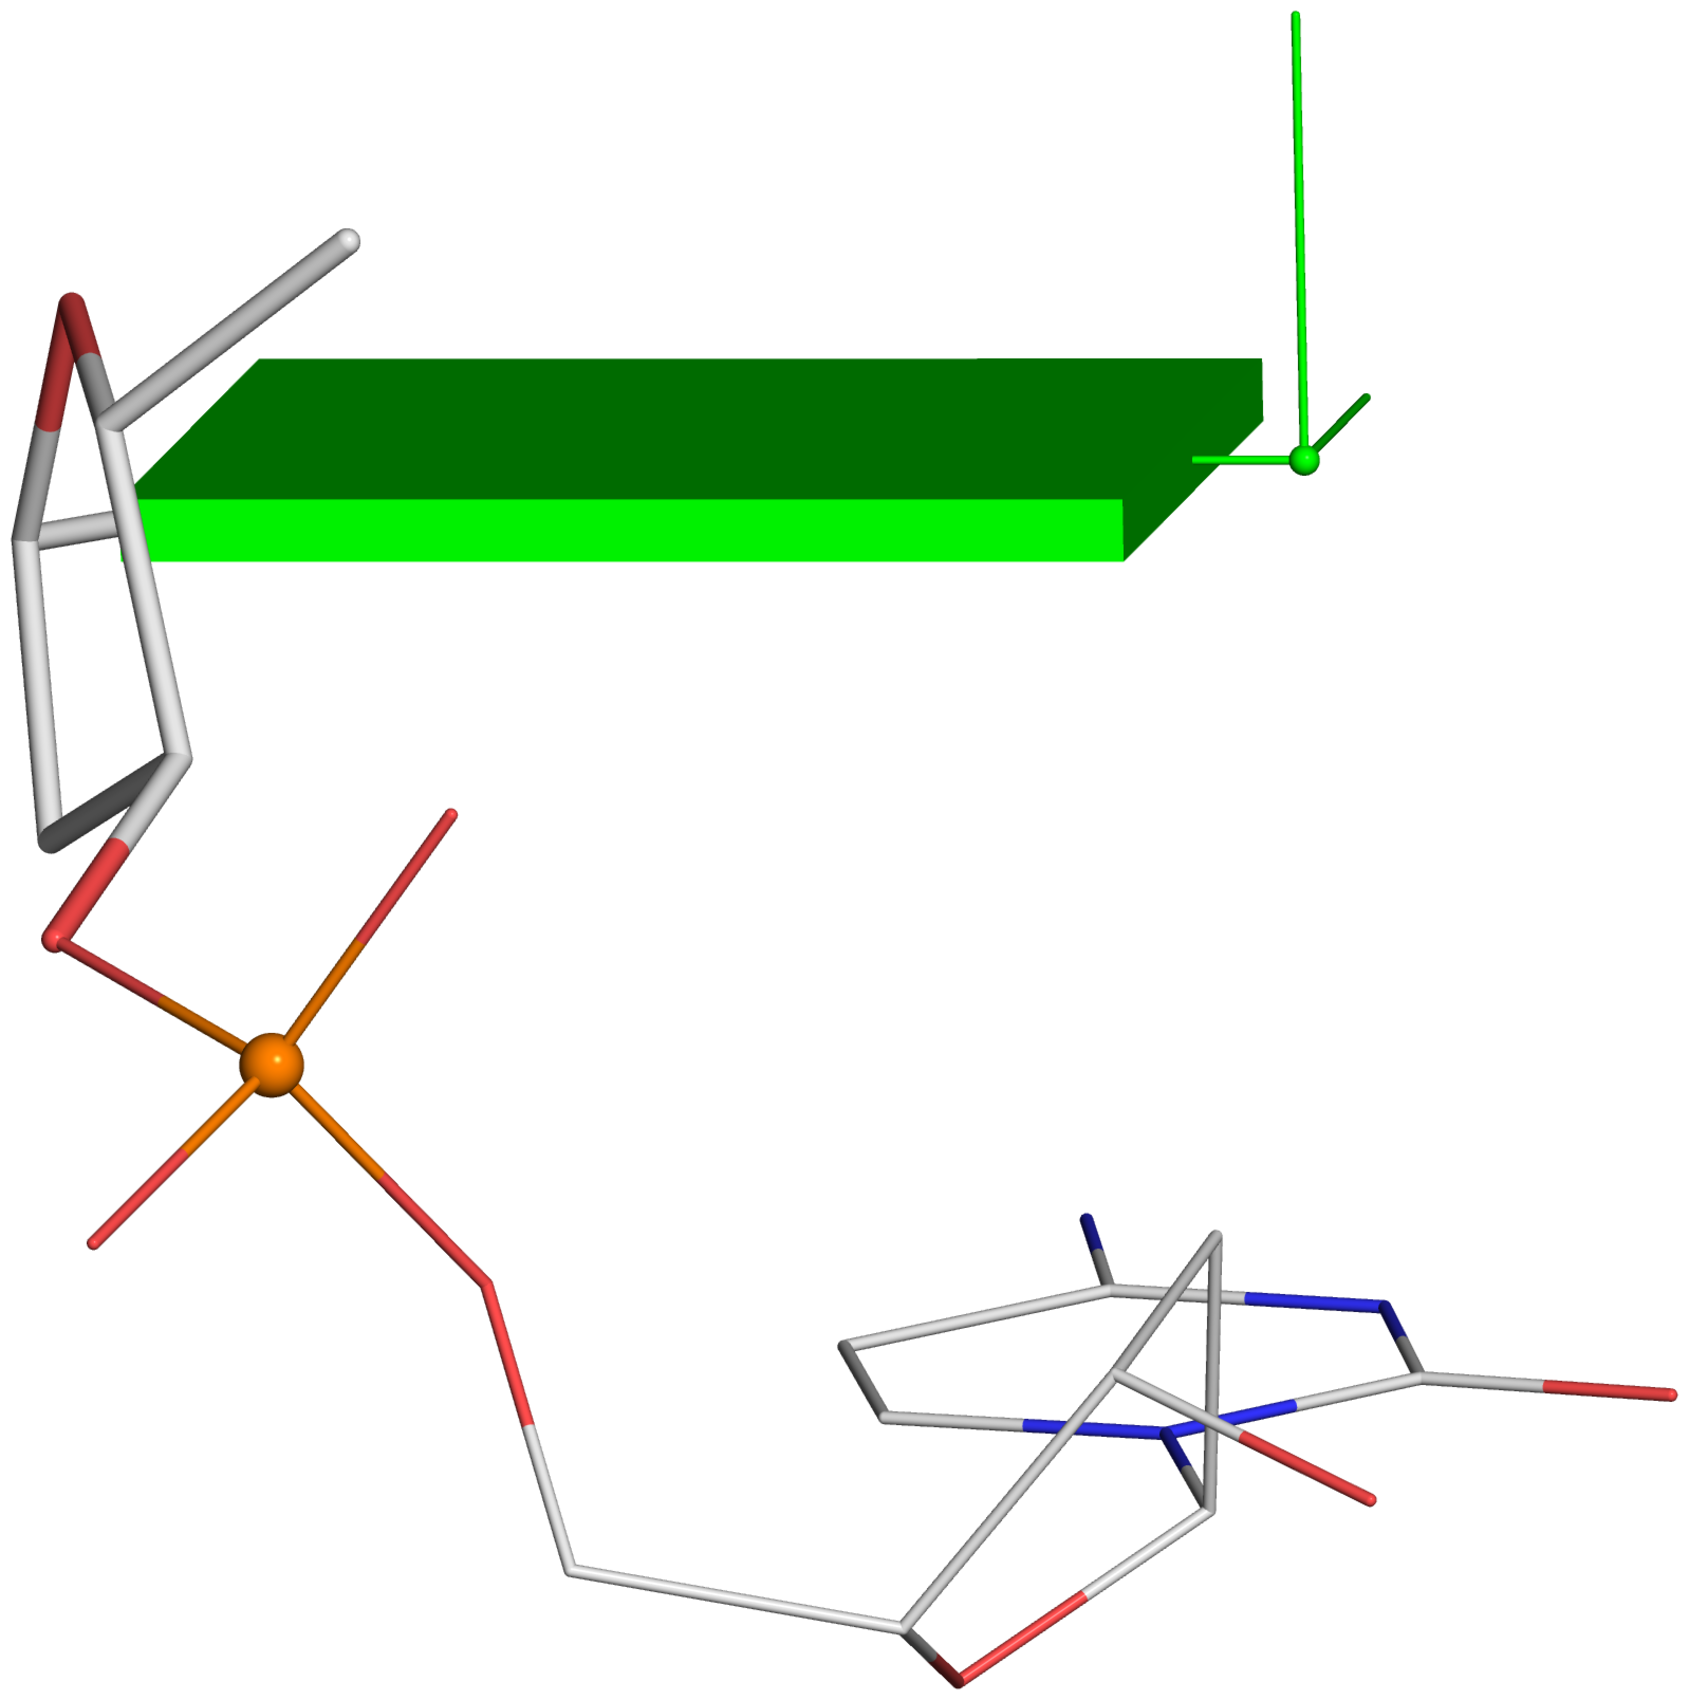
--
Fig. 2DHere are the associated files for Fig. 2B:
And the associated files for Fig. 2D:
See also the following blogposts:


 Topic: Figure 2. New structural parameters (Read 285624 times)